Autonomous AI System for Multi-Pathology Detection in Chest X-Rays
A multi-site study across 17 Indian healthcare systems
TL;DR
5C Network's autonomous chest X-ray AI detects 84 pathologies with 98% precision and 95% recall, achieving a mean AUC of 0.97 across all findings. Trained on 5 million+ CXRs and validated across 17 healthcare systems — including government hospitals, private facilities, and diagnostic centers — the system performs consistently across patient demographics, equipment manufacturers, and machine types. Three pathologies achieved perfect 1.00 AUC. No pathology scored below 0.95.
What makes this study different?
Comprehensive Pathology Coverage
Detects 84 chest X-ray pathologies across 8 clinical categories — from fractures and foreign bodies to infections and pleural conditions.
Multi-Site Validation
Trained on 5M+ CXRs from varied Indian healthcare settings, capturing diverse demographics, equipment manufacturers, and imaging protocols.
Real-World Clinical Impact
Deployed in 17 large healthcare systems. Reduces turnaround time and improves diagnostic accuracy in underserved facilities with limited radiology coverage.
High Diagnostic Accuracy
98% precision and 95% recall across all pathologies. Zero pathologies below 0.95 AUC. Three pathologies achieved a perfect 1.00 AUC score.
How does the AI pipeline work?
A six-stage pipeline processes each chest X-ray from raw DICOM to annotated findings
DICOM Ingestion
Raw DICOM images converted to standardized format using pydicom
Validity Check
Automated verification that the image is a valid chest X-ray
View Identification
PA/AP/lateral view classification and rotation correction
Normal vs Abnormal
Vision Transformer with ensembling classifies the study
Pathology Detection
Faster R-CNN localizes and identifies abnormalities
Pathology Segmentation
U-Net family (Attention U-Net, U-Net++, Dense U-Net) generates precise contours
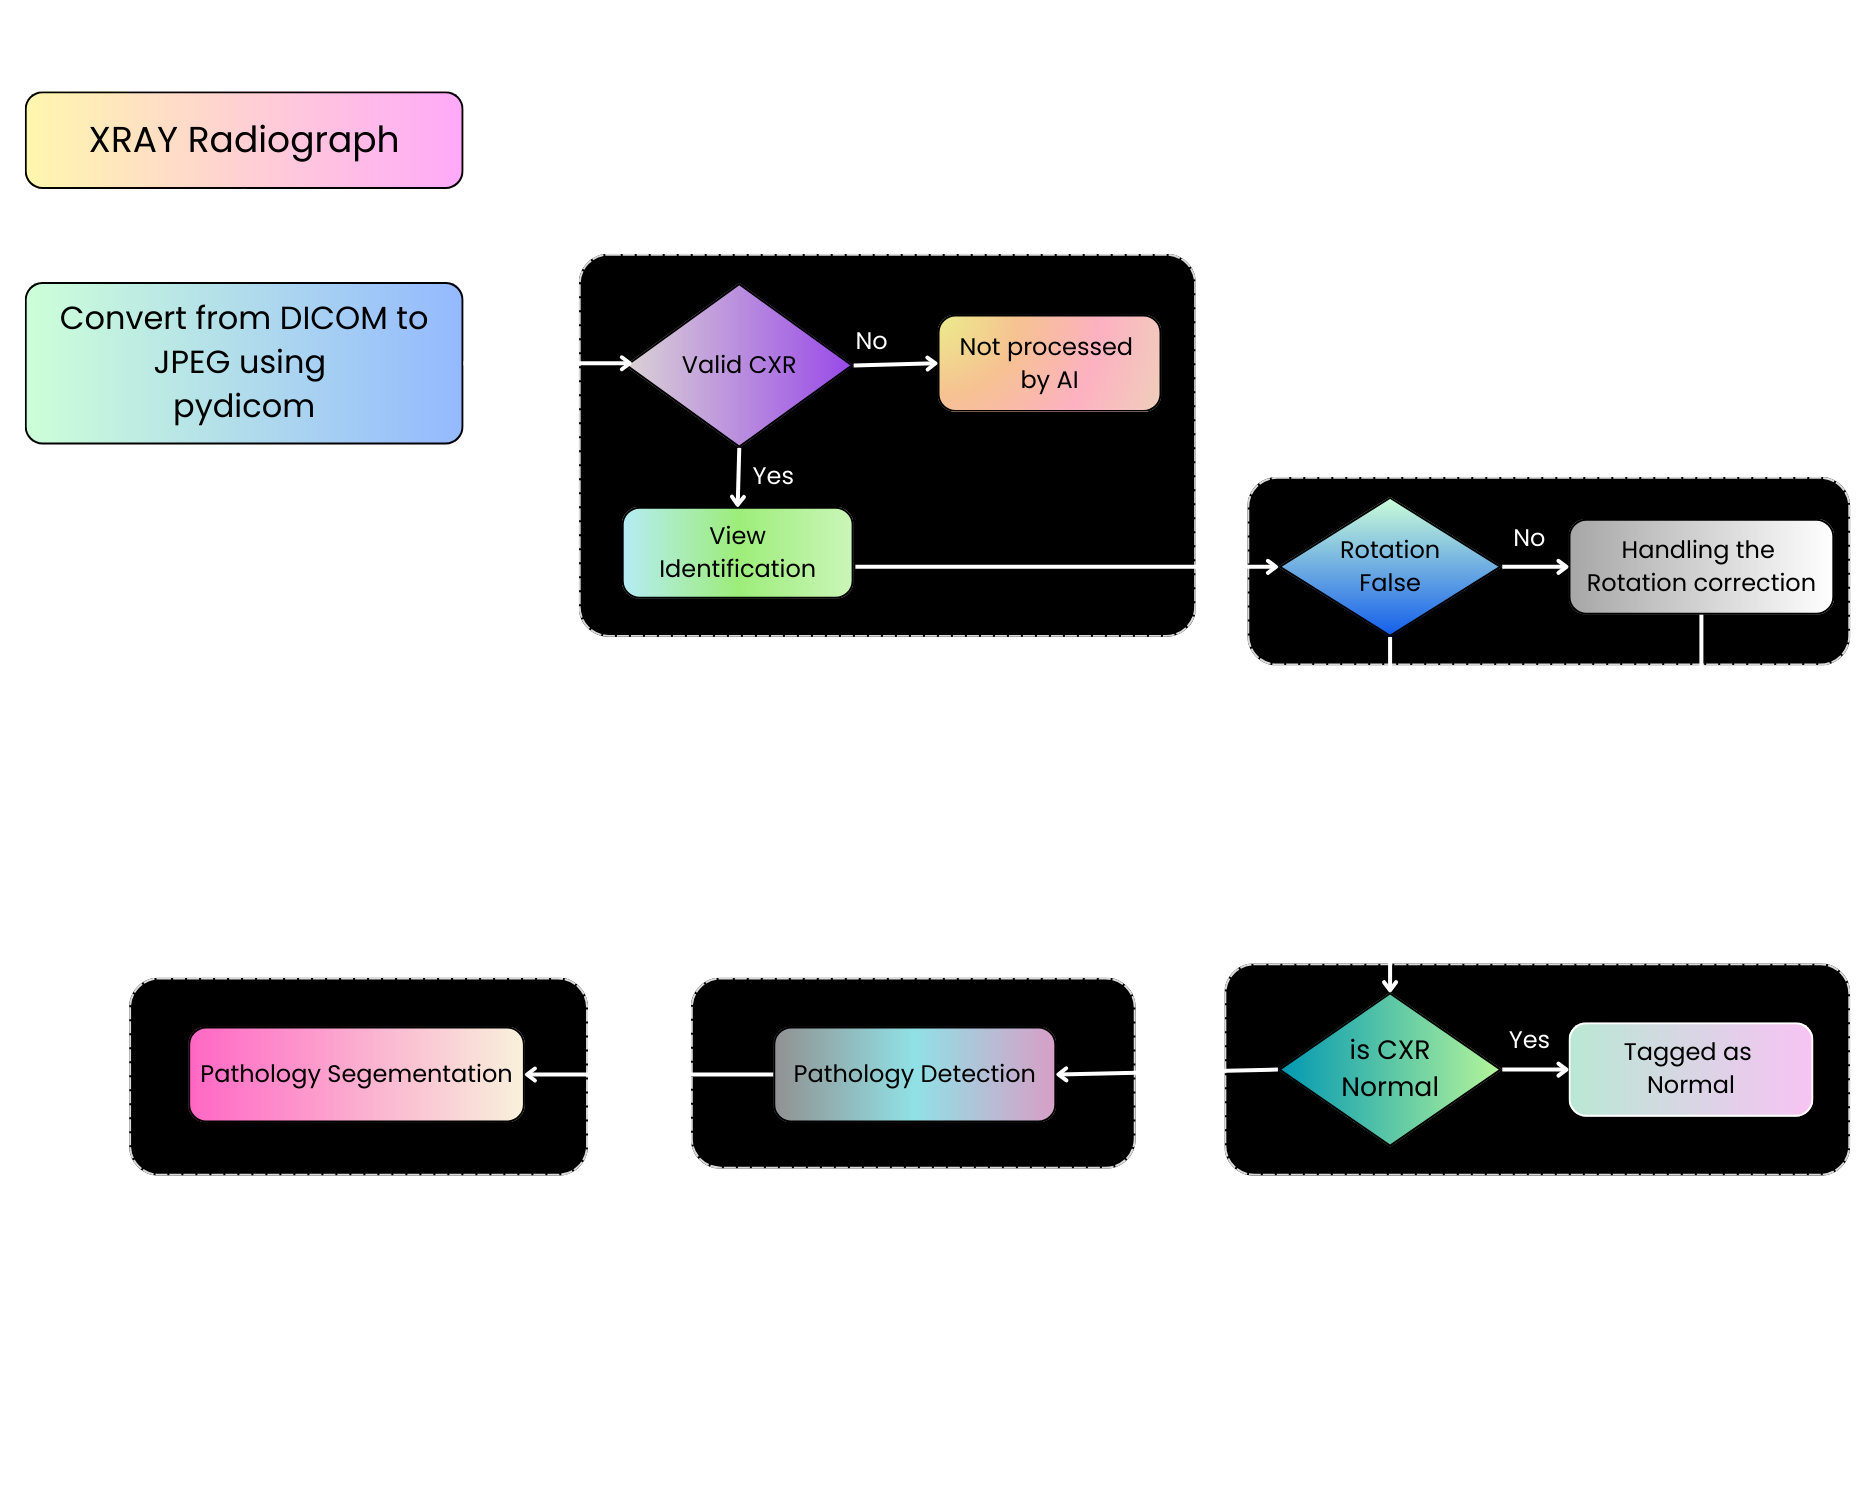
End-to-end architecture: Vision Transformer for classification, Faster R-CNN for detection, U-Net family for segmentation
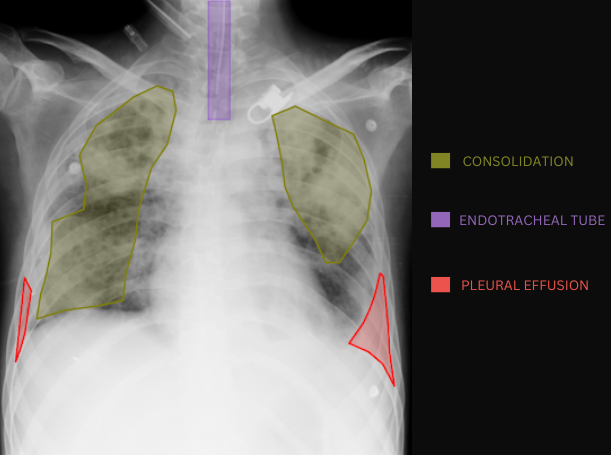
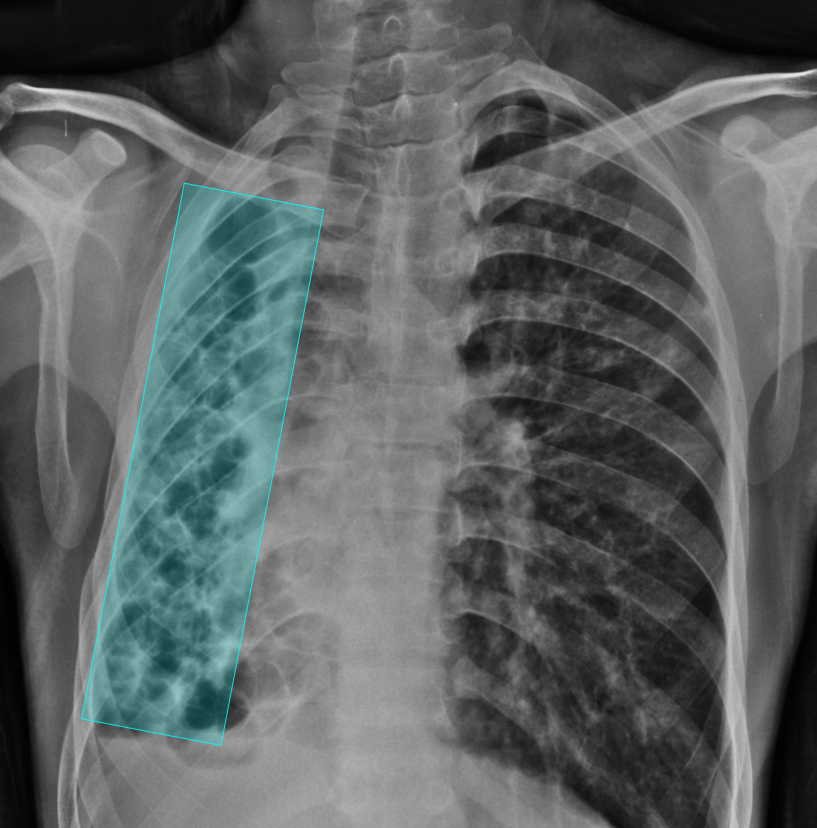
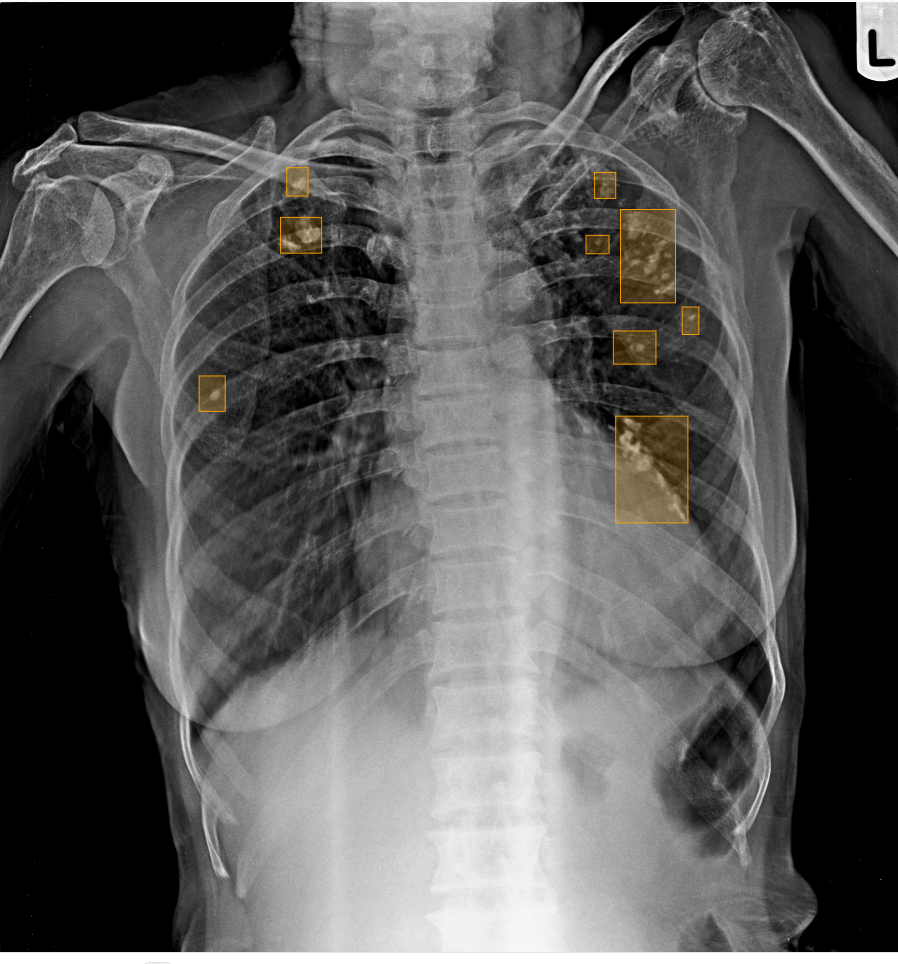
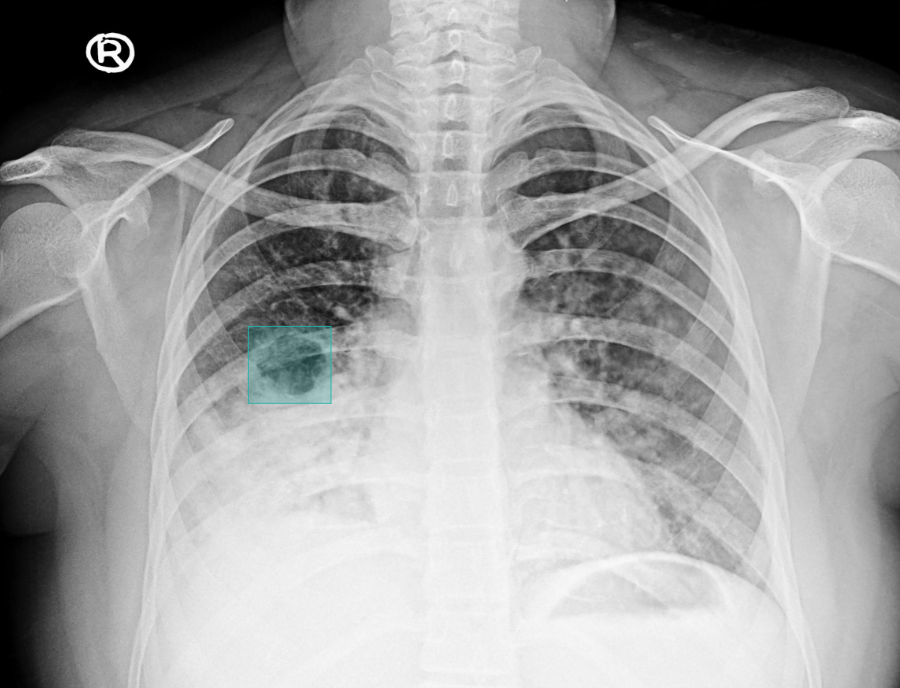
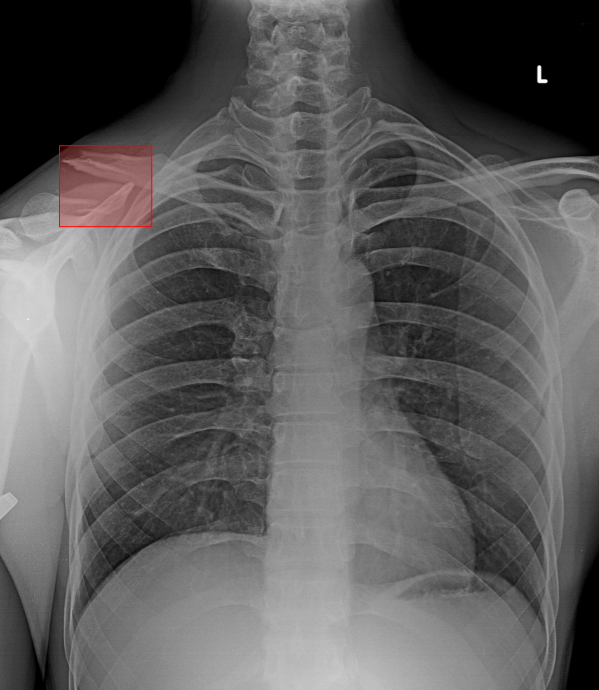
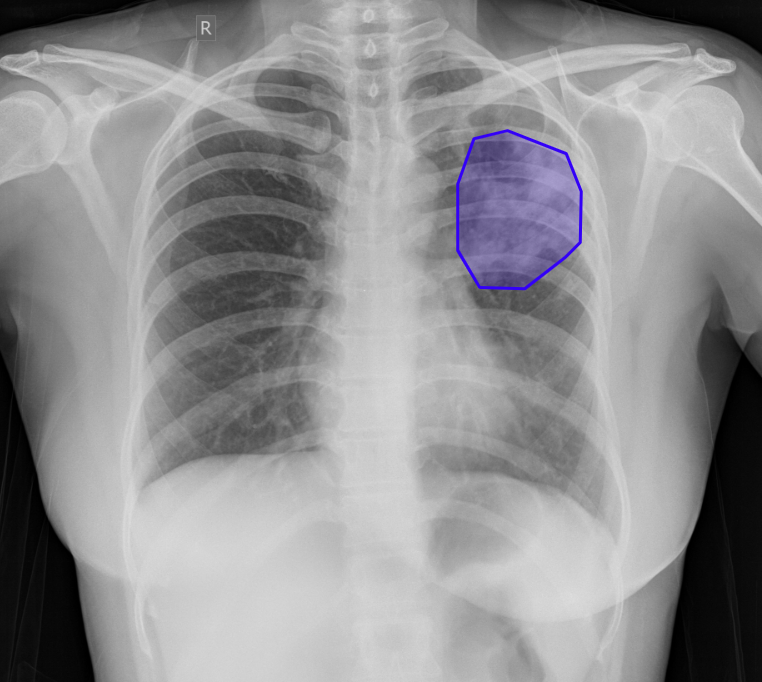
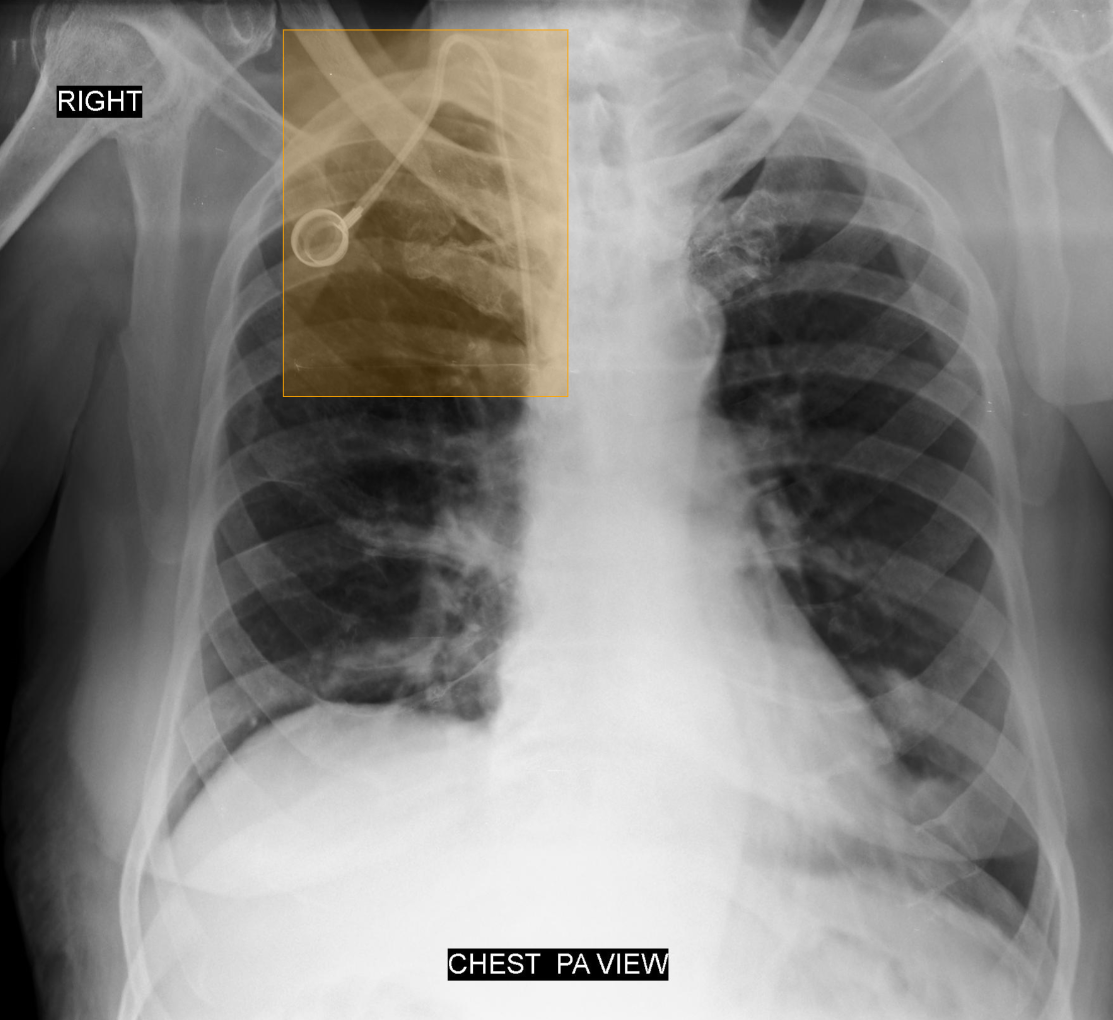
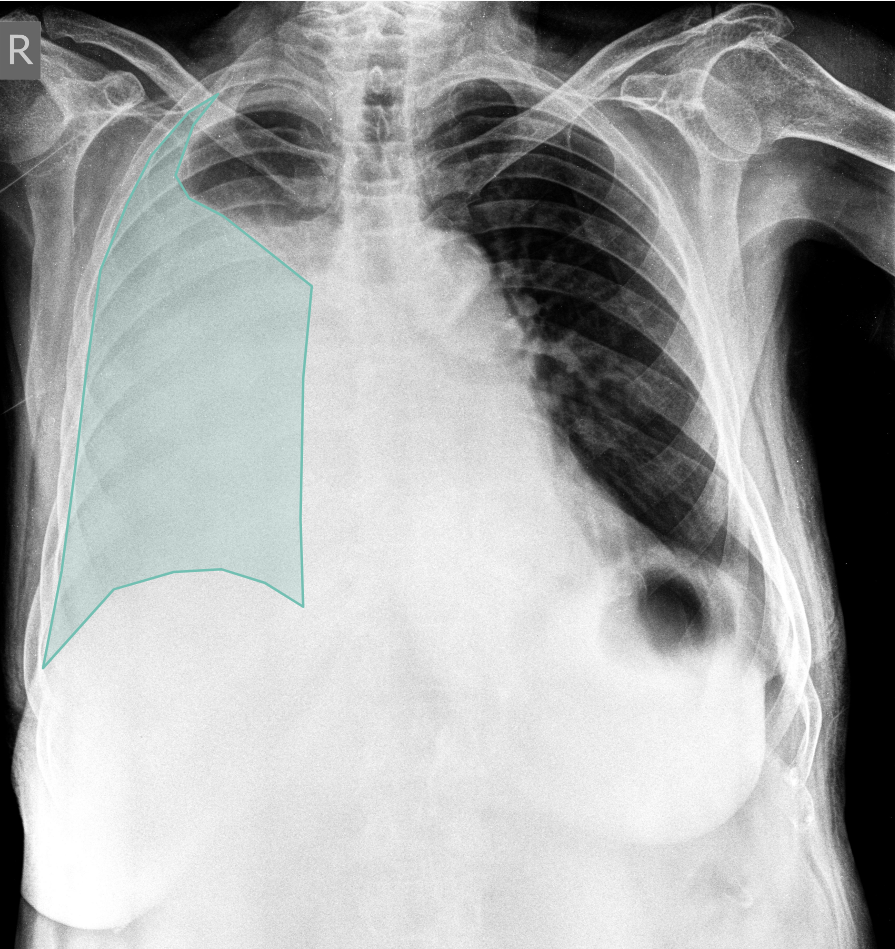
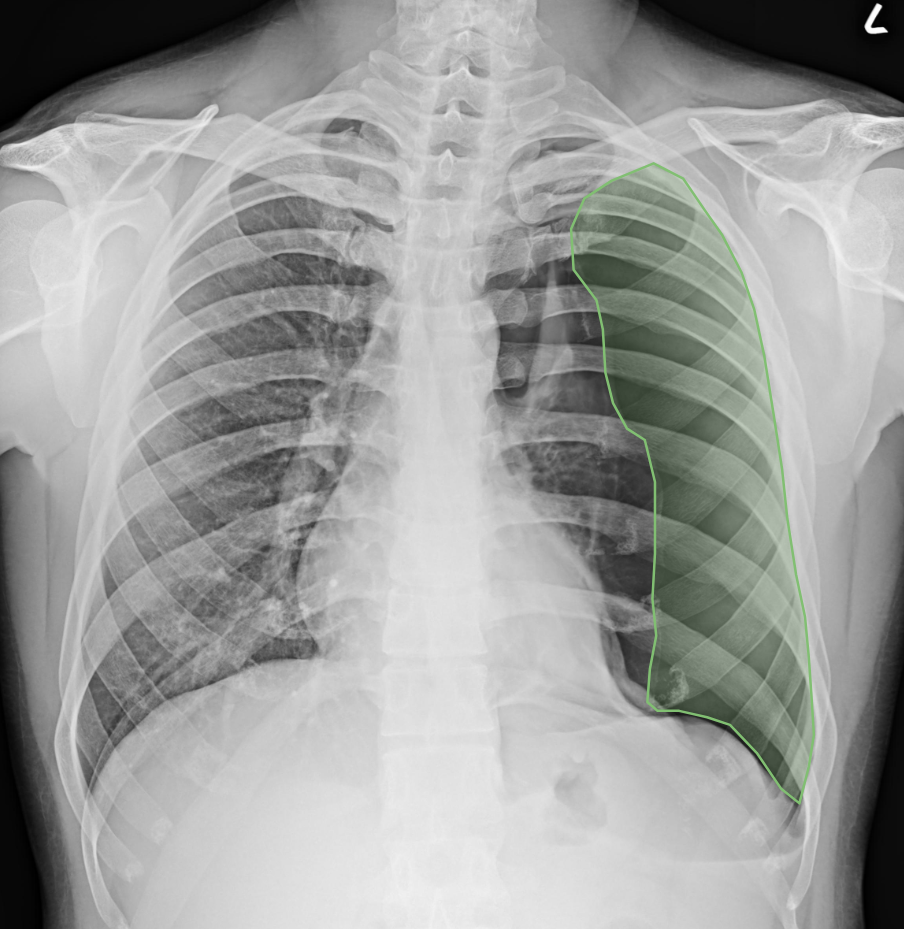
What does AI-detected pathology look like?
Eight examples of AI-annotated chest X-rays with color-coded pathology overlays
How does each pathology perform?
AUC (Area Under the Curve) scores for all 75 evaluated pathologies, grouped by clinical category. All pathologies score 0.95 or higher.
AUC (Area Under the ROC Curve) measures diagnostic accuracy. 1.00 = perfect classification. All bars scaled from 0.90 to 1.00.
Does the AI perform equally across patient groups?
Subgroup analysis confirms consistent accuracy across demographics and equipment
By Age Group
By Gender
By Equipment Manufacturer
By Machine Type
How does performance compare across facility types?
Consistent diagnostic accuracy across all healthcare settings, with minimal variance between facility types
| Facility Type | Performance | Consistency |
|---|---|---|
| Government Hospitals | High | Stable across pathologies |
| Large Private Hospitals | High | Stable across pathologies |
| Small & Medium Private Hospitals | High | Stable across pathologies |
| Diagnostic Centers | High | Stable across pathologies |
Radar chart analysis shows near-identical performance curves across all four facility types, confirming generalizability.
"What differentiates this study from most radiology AI research is the validation across 17 real healthcare systems, not curated datasets. The consistent performance across government hospitals, private facilities, and diagnostic centers shows that the model generalizes to the conditions where it actually needs to work."
Frequently Asked Questions
Explore the AI behind these results
Meet Bionic, the AI co-radiologist that reads scans for 2,000+ hospitals. Read our published research or see implementation results from real facilities.